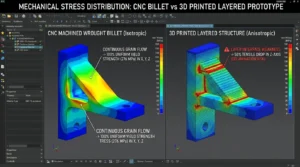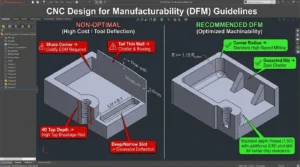
Selecting the optimal engineering material for CNC milling and turning requires balancing mechanical performance, physical stability, chip formation mechanics, and economic yield. While structural datasheets provide fundamental tensile and yield values, they frequently omit the practical shop-floor variables that dictate whether a component can be manufactured reliably to tight tolerances: cutting shear resistance, thermal expansion coefficients, work-hardening kinetics, and tool wear rates.
A material with superior yield strength on paper can double or triple overall machining cycle time, accelerate abrasive flank wear on solid carbide cutters, and introduce severe residual stress warping during bulk material removal. Conversely, selecting a free-machining alloy when structural or thermal demands require an engineered precipitation-hardened metal or high-performance fluoropolymer risks catastrophic in-service component failure.
This comprehensive technical guide serves as an authoritative desk reference for mechanical design engineers, hardware architects, and manufacturing procurement professionals. Below are the quantitative property matrices, AISI machinability ratings, thermal expansion physics, and true finished-part cost equations across more than 25 commercial metals and engineering plastics machined daily in precision manufacturing facilities.
For a broader evaluation of material selection methodology, consult our companion CNC material selection guide, or review our full scope of production capabilities on our CNC machining materials manufacturing hub.
1. How to Read the CNC Machining Materials Master Matrix
To extract actionable engineering value from the data tables below, components must be evaluated across five interconnected performance vectors rather than isolated tensile metrics:
- Mechanical Rigidity and Strength: Yield strength (R_{p0.2}) determines elastic deflection limits under operational loads, while ultimate tensile strength (R_m) governs ultimate shear failure. For rotating or dynamically loaded parts, hardness (measured in Brinell HB or Rockwell HRC/HRR) dictates surface contact fatigue life and resistance to fretting.
- Standardized Machinability (AISI Index %): Based on the American Iron and Steel Institute (AISI) benchmark, machinability represents the relative cutting speed at which a material can be machined while achieving standard tool life, compared to cold-drawn AISI 1212 steel designated at 100%. Higher percentages denote lower cutting resistance, better chip breaking, and reduced spindle horsepower requirements.
- Recommended Surface Cutting Speed (v_c): Expressed in meters per minute (m/min), this metric represents the linear velocity between the cutting edge and workpiece. Highly machinable materials such as C360 brass and 6061-T6 aluminum support high-speed machining (v_c > 300 m/min), whereas austenitic stainless steels and refractory titanium alloys require controlled feeds and lower velocities (v_c < 60 m/min) to prevent thermal breakdown of cutting tool edges.
- Thermal Expansion Coefficient (α): Critical for achieving tight linear and geometric tolerances. Expressed in 10^{-6}/K (μm/m×°C), this coefficient reveals dimensional drift when heat enters the workpiece from tool engagement friction or ambient shop-floor fluctuations. Polymers exhibit thermal expansion up to ten times greater than structural steels, demanding dedicated thermal stabilization protocols.
- Relative Finished Part Cost Factor: Raw billet stock price per kilogram (/kg) is frequently deceptive. The true finished part cost factor integrates billet acquisition, cycle time amortization (t_{cycle}), tool depreciation, and post-machining operations (such as stress relieving, passivation, or anodizing).
The 5 Primary Vectors of CNC Material Selection
2. Master CNC Materials Comparison Matrix (Metals & Engineering Plastics)
The following reference tables synthesize physical, mechanical, thermal, and manufacturing parameters for 17 industrial metal alloys and 8 engineering polymers. All values reflect standard ambient conditions (20°C / 68°F) under certified mill conditions.
Table 1: Master Metal Alloys Comparison Chart
| Material Grade & Condition | Density (g/cm³) | Yield Strength (MPa) | Tensile Strength (MPa) | Hardness | AISI Machinability (%) | Rec. Cutting Speed v_c (m/min) | Relative Raw Cost Factor | Primary Engineering Applications & Trade-offs |
|---|---|---|---|---|---|---|---|---|
| Aluminum 6061-T6 | 2.70 | 276 | 310 | 95 HB | 270% | 250 – 450 | 1.0× (Baseline) | General structural enclosures, automotive brackets, heat sinks. High corrosion resistance, excellent weldability, anodizes cleanly. For tempers, see our aluminum alloy grades guide. |
| Aluminum 7075-T651 | 2.81 | 503 | 572 | 150 HB | 200% | 200 – 350 | 2.2× | Aerospace structural bulkheads, high-stress gears, suspension linkages. Zinc-alloyed, exceptional strength-to-weight, lower corrosion resistance than 6061. |
| Aluminum 2024-T3 | 2.78 | 290 | 435 | 120 HB | 210% | 200 – 380 | 1.8× | Aircraft fuselage fittings, high-fatigue tension members. Copper-alloyed, excellent fatigue resistance, sensitive to stress corrosion cracking. |
| Aluminum 5052-H32 | 2.68 | 193 | 228 | 60 HB | 180% | 200 – 350 | 1.1× | Marine sheet enclosures, hydraulic tubing, fuel tanks. Magnesium-alloyed, superior saltwater corrosion resistance, gummy chip formation. |
| Carbon Steel 1018 | 7.87 | 365 | 440 | 126 HB | 78% | 80 – 140 | 0.8× | Shafts, pins, welded machine frames. Low carbon, excellent weldability and case-hardening potential, forms long continuous stringy chips. |
| Carbon Steel 1045 | 7.85 | 450 | 625 | 170 HB | 65% | 70 – 120 | 0.9× | Heavy-duty studs, transmission shafts, hydraulic cylinder rods. Medium carbon, through-hardenable, predictable chip curling under heavy feeds. See our carbon and alloy steels analysis. |
| Alloy Steel 4140 (Q&T) | 7.85 | 655 – 850 | 850 – 1000 | 28 – 32 HRC | 65% | 60 – 110 | 1.3× | Crankshafts, high-torque drive axles, heavy-duty spindle tooling. Chromium-molybdenum pre-hardened, high torsional strength and fatigue endurance. |
| Alloy Steel 4340 | 7.85 | 860 – 1000 | 1100 – 1280 | 32 – 38 HRC | 50% | 45 – 85 | 2.1× | Aerospace landing gear cylinders, high-impact drive shafts. Nickel-chromium-moly, deep hardenability, extreme fracture toughness. |
| Free-Cutting 12L14 | 7.87 | 415 | 540 | 163 HB | 170% | 150 – 240 | 0.9× | High-volume screw machine bushings, hydraulic manifold inserts. Lead and sulfur additions provide discontinuous micro-chips, excellent surface finish. |
| Stainless 303 | 7.93 | 240 | 620 | 160 HB | 140% | 100 – 180 | 2.8× | Turned precision standoffs, threaded fittings, valve components. Free-machining austenitic with added sulfur. Reduced pitting corrosion resistance vs 304. For tooling specs, see our CNC stainless steel guide. |
| Stainless 304 / 304L | 7.93 | 215 | 505 | 170 HB | 45% | 45 – 75 | 2.5× | Food processing equipment, architectural hardware, chemical tubing. Austenitic standard, severe work hardening, requires positive rake angles and rigid fixturing. |
| Stainless 316 / 316L | 8.00 | 220 | 515 | 175 HB | 40% | 40 – 70 | 3.3× | Marine fluid handling, medical implant housings, petrochemical valves. 2-3% Molybdenum addition imparts superior pitting and chloride resistance. |
| 17-4 PH (Condition A) | 7.75 | 760 | 1030 | 30 HRC | 55% | 50 – 90 | 4.2× | High-strength aerospace valves, pump shafts, turbine blades. Martensitic precipitation-hardening. Easily machined in Condition A, then heat-treated to H900 (44 HRC) with minimal dimensional shift. |
| Brass C360 (Free-Cutting) | 8.50 | 310 | 400 | 130 HB | 300% | 250 – 500 | 2.4× | Fluid fittings, pneumatic valves, electrical terminals. Industry gold standard for high-speed CNC turning. Discontinuous needle chips. Detailed comparisons in our brass CNC machining guide. |
| Copper C145 (Tellurium) | 8.94 | 260 | 330 | 110 HB | 85% | 120 – 200 | 4.5× | Resistance welding tips, electrical switch contacts, precision torch nozzles. Free-machining tellurium copper with 93% IACS electrical conductivity. |
| Titanium Ti-6Al-4V (Gr5) | 4.43 | 880 | 950 | 36 HRC | 22% | 25 – 45 | 9.5× | Aerospace engine mounts, medical orthopedic fasteners. Extreme strength-to-weight, biological inertness, poor thermal conductivity, high galling tendency. For feed parameters, see our titanium CNC machining review. |
| Gray Cast Iron (Class 40) | 7.15 | 275 (Tensile) | 290 | 210 HB | 75% | 60 – 110 | 0.7× | Machine tool beds, vibration-damping motor mounts, brake rotors. Flake graphite provides outstanding damping capacity and natural lubricity, dry machining generates abrasive fine dust. |
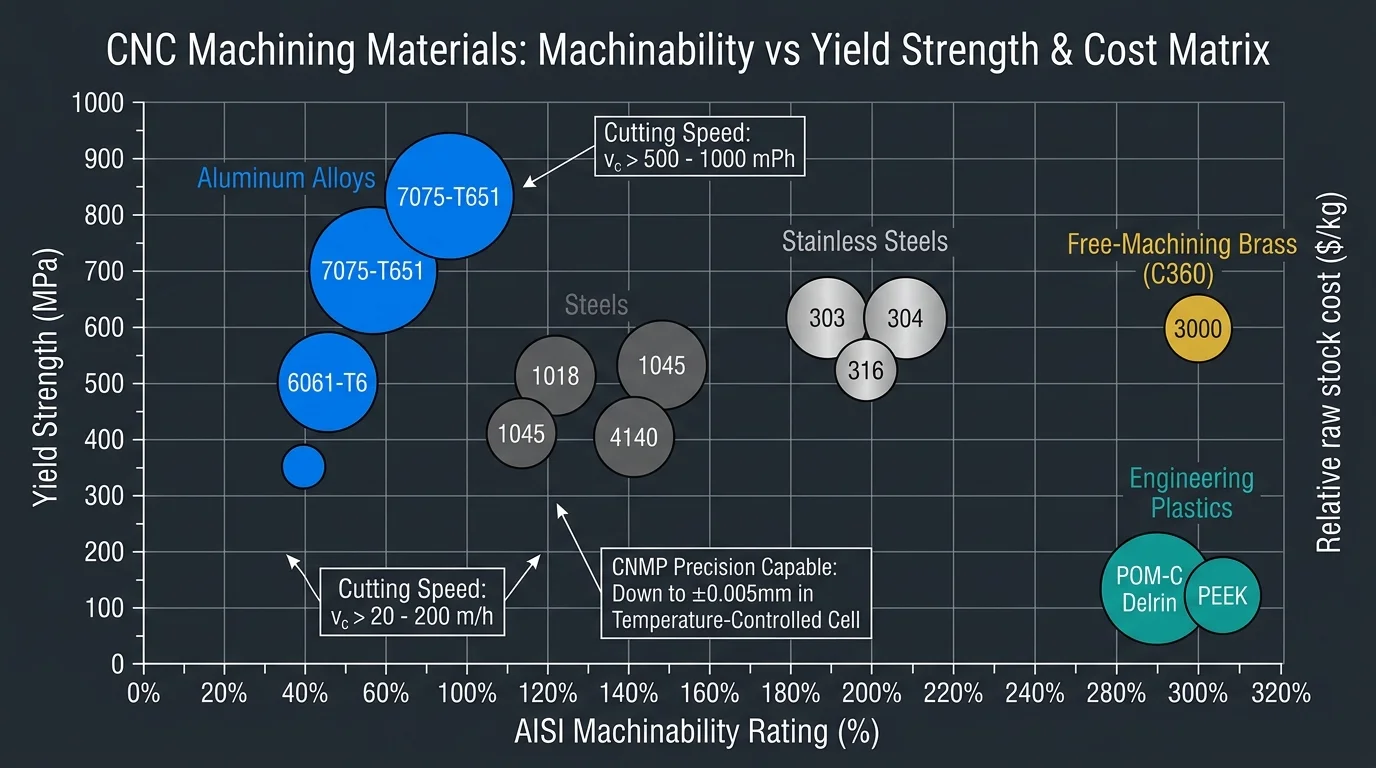
Table 2: Master Engineering Plastics Comparison Chart
Engineering plastics exhibit distinct mechanical, thermal, and moisture absorption behaviors compared to structural metals. When milling or turning polymers, tool geometry and chip evacuation govern dimensional stability.
| Polymer Grade | Density (g/cm³) | Tensile Strength (MPa) | Hardness | Max Continuous Temp (°C) | Thermal Exp. α (10^{-6}/K) | Chip Formation & Machinability | Relative Raw Cost Factor | 24h Moisture Absorption (%) | Typical Engineering Applications |
|---|---|---|---|---|---|---|---|---|---|
| POM-C (Acetal / Delrin) | 1.41 | 65 | M84 | 100 | 110 | Continuous, clean ribbon; outstanding dimensional hold | 1.2× | 0.20% | Precision gears, fuel sender housings, low-friction guide bushings, electrical isolators. |
| PEEK (Unfilled 450G) | 1.30 | 100 | M105 | 250 | 47 | Continuous, tough; requires sharp polished tools | 18.0× | 0.10% | Semiconductor wafer handling chucks, aerospace back-up rings, autoclavable medical surgical tools. |
| Nylon 6/6 (PA66) | 1.14 | 82 | M85 | 95 | 90 | Tough, ductile; prone to burring and gumming | 1.4× | 1.50% | Heavy-duty wear pads, conveyor drive sprockets, industrial rollers. Note high moisture swelling. |
| PTFE (Teflon) | 2.16 | 28 | D55 | 260 | 135 | Soft, flexible; cold-flows under clamping pressure | 4.5× | <0.01% | Cryogenic fluid seals, chemical valve seats, RF dielectric insulators. Low mechanical rigidity. |
| Polycarbonate (PC) | 1.20 | 65 | M70 | 120 | 65 | Ductile; sensitive to internal stresses, stress crazing | 1.8× | 0.15% | Optical manifolds, shatterproof inspection sight glasses, high-impact electronic housings. |
| ABS | 1.05 | 45 | R105 | 80 | 85 | Excellent shearing; easily glued and solvent welded | 0.8× | 0.30% | Functional proof-of-concept prototypes, consumer electronics enclosures, automotive dashboard fixtures. |
| PMMA (Acrylic) | 1.18 | 72 | M95 | 70 | 70 | Brittle; requires razor diamond tooling to prevent chipping | 1.3× | 0.30% | Transparent microfluidic test chips, optical lenses, illuminated diagnostic displays. |
| UHMW-PE | 0.94 | 22 | D65 | 80 | 180 | Fibrous, low friction; difficult to deburr cleanly | 1.1× | <0.01% | Chute liners, packaging machinery guides, marine dock bumper wear strips. |
For deep-dive tooling and feeds for polymer machining, refer to our engineering plastics machining resource.
3. The AISI Machinability Rating System: Physics & Cutting Mechanics
The AISI machinability index is not an arbitrary marketing descriptor; it is an empirical metric derived from standardized single-point turning and end-milling dynamometer trials under controlled lubrication conditions.
The AISI 1212 Baseline Standard
The index benchmarks AISI 1212 cold-drawn carbon steel at exactly 100% machinability. Under standardized American test conditions, AISI 1212 turns at a surface cutting speed of approximately 55 m/min (180 ft/min) using a standard M2 high-speed steel (HSS) tool under heavy flood coolant, yielding an average tool life of 60 minutes before reaching 0.3 mm flank wear (VB).
When a material is rated at 270% (such as 6061-T6 aluminum), it can be machined at 2.7 times the linear cutting speed of AISI 1212 (v_c ≈ 150 m/min with HSS, and >400 m/min with polished CVD-coated or uncoated solid carbide) while maintaining equivalent tool life. Conversely, a material rated at 40% (such as 316 stainless steel) requires its cutting velocity to be throttled down to 40\% of the baseline (v_c ≈ 22 m/min with HSS, or 45–65 m/min with multi-layer TiAlN-coated carbide) to avoid rapid abrasive edge failure and plastic deformation of the insert.
| Machinability Tier | AISI Rating Index | Representative CNC Materials | Shop Floor Machining Characteristics |
|---|---|---|---|
| Tier 1: Free-Machining | 150% – 300%+ | C360 Brass (100% baseline = 360), 6061-T6 (270%), POM-C Delrin (300%+) | Discontinuous chips, high feed velocity, minimal cutting force and tool wear. |
| Tier 2: Standard Production | 70% – 140% | AISI 1212 (100% baseline), 303 Stainless (140%), 1045 Carbon Steel (75%) | Predictable tool life, manageable chip curl, standard carbide tooling. |
| Tier 3: Moderate Difficulty | 40% – 65% | 4140 Alloy Steel (65%), 304 Stainless (45%), 316L Stainless (40%) | High work hardening, continuous stringy chips, high-pressure coolant required. |
| Tier 4: Exotic / Refractory | 15% – 30% | Ti-6Al-4V Grade 5 (22%), Inconel 718 (15%), Hastelloy C-276 (18%) | Extreme shear heat, low thermal conductivity, rapid crater wear, throttled cutting speeds. |
The Taylor Tool Life Relationship
The physical correlation between cutting speed, material resistance, and tool durability is governed by F.W. Taylor’s fundamental equation:
vc × Tn = C
Where:
- v_c = Cutting speed (m/min)
- T = Tool life to failure (minutes)
- n = Taylor exponent, determined by workpiece alloy and tool material composition (typically 0.12–0.15 for HSS, 0.25–0.35 for carbide in steels, and 0.40–0.50 for carbide in aluminum)
- C = Constant cutting velocity representing tool life of exactly 1 minute
Because the exponent n appears in the denominator when calculating tool life (T = (C / v_c)^{1/n}), small increases in cutting velocity on low-machinability alloys precipitate severe, exponential drops in tool life. Machining 304 or 316 stainless steel just 20\% too fast can slash end mill operational life from 75 minutes down to under 12 minutes, triggering unexpected cutter failure, dimensional gouging, and scrap parts.
The Three Distinct Machinability Tiers
- Free-Machining Tier (>150% Rating):
- Representative Alloys: C360 Brass, 6061-T6 Aluminum, 12L14 Steel.
- Cutting Physics: Shear zone temperatures remain below 350°C. Metallurgical additives (lead in 12L14 and C360; magnesium-silicon precipitates in 6061) promote microscopic shear plane stress concentrations, causing chips to fracture cleanly into small commas or needles rather than forming tangled ribbons. Cutting forces are low, spindle power consumption is minimal, and tool wear is predominantly gradual abrasive clearance wear.
- Standard Engineering Structural Tier (60% to 120% Rating):
- Representative Alloys: AISI 1045, 4140 Pre-hardened, Delrin POM-C, Cast Iron Class 40.
- Cutting Physics: Requires rigid machine tool kinematic loops and moderate cutting forces. Carbon content in steels increases shear flow stress; tool coatings such as AlCrN or TiCN are mandatory to prevent built-up edge (BUE) formation. Chip breakers on carbide inserts are critical to curl and shatter the continuous chip.
- Severe Work-Hardening & Refractory Tier (<50% Rating):
- Representative Alloys: 304/316 Stainless Steel, Inconel 718, Titanium Ti-6Al-4V Grade 5.
- Cutting Physics: Nickel and chromium in austenitic steels create rapid deformation hardening in the shear plane ahead of the tool. If the cutter dwells or rubs with a light feed (f_z < 0.04 mm/tooth), the cutting edge plows through work-hardened material (>380 HB), causing catastrophic notch wear at the depth-of-cut line. Titanium’s low thermal conductivity (7.2 W/m×K vs. 167 W/m×K for 6061 aluminum) traps over 80\% of cutting heat inside the tool tip, requiring high-pressure through-spindle coolant (>70 bar) to flush the contact zone.
4. Thermal Expansion & Plastic Machining: The Tight-Tolerance Dilemma
One of the most persistent failure modes in precision manufacturing occurs when design engineers apply standardized metal tolerances (such as ± 0.01 mm or ISO 2768-m) to engineering plastic drawings without accounting for thermodynamic physics.
The Physics of Dimensional Drift
Thermal linear dimensional change is governed by the thermodynamic equation:
ΔL = L0 × α × ΔT
Where:
- Δ L = Total dimensional change (linear drift in mm)
- L_0 = Nominal dimension feature length (mm)
- α = Linear Coefficient of Thermal Expansion (10^{-6}/K or mm/mm×°C)
- Δ T = Temperature variance between machining environment and final metrology room (°C)
Thermal Expansion Comparison Table
Consider the profound variance in thermal expansion coefficients across common CNC engineering stock:
| Material Classification | Material Grade | Coefficient of Thermal Expansion α (10^{-6}/K) | Drift on 100 mm Feature over Δ T = 15°C (μm) | Feasibility of Holding ± 0.01 mm |
|---|---|---|---|---|
| Medium Carbon Steel | AISI 1045 | 11.5 | +17.3 μm (+0.017 mm) | High (with standard coolant control) |
| Austenitic Stainless | 304 Stainless | 17.2 | +25.8 μm (+0.026 mm) | High (requires thermal stabilization) |
| Structural Aluminum | 6061-T6 | 23.5 | +35.3 μm (+0.035 mm) | High (requires calibrated compensation) |
| Engineering Polymer | PEEK Unfilled | 47.0 | +70.5 μm (+0.071 mm) | Moderate (requires roughing + annealing) |
| Semi-Crystalline Acetal | POM-C (Delrin) | 110.0 | +165.0 μm (+0.165 mm) | Extremely Low / Impractical |
| Fluoropolymer | PTFE (Teflon) | 135.0 | +202.5 μm (+0.203 mm) | Physically Impossible |
The Summer Afternoon Workshop Scenario
Consider an illustrative engineering scenario: A mechanical engineer designs a POM-C (Delrin) valve plate housing with a critical Ø 100 mm bearing bore and specifies a bilateral tolerance of ± 0.01 mm (± 10 μm).
During rough milling and finishing on an uncompensated 3-axis CNC machine on a warm summer afternoon, frictional shear heating and ambient shop temperatures elevate the workpiece core temperature to 35°C. The machinist zeros their bore micrometers and cuts the feature to a perfect 100.000 mm at 35°C.
When the completed part is packaged and transported into a quality control laboratory operating at the international metrology baseline of 20°C (Δ T = -15°C), thermal contraction occurs:
ΔL = 100 mm × (110 × 10-6) × (-15°C) = -0.165 mm
Upon CMM inspection at 20°C, the bearing bore measures 99.835 mm—a massive 0.165 mm out of tolerance, resulting in part rejection. The fault lies not in machining precision, but in failing to account for thermodynamic material physics.
| Thermal State | Workpiece Temp | Measured Bore Diameter | Dimensional Variance vs Target (100.000 mm) |
|---|---|---|---|
| During In-Spindle Cutting | 35°C (95°F) | 100.000 mm | Nominal in-process dimension (Frictional heat expansion) |
| Cooling to Lab Ambient | 20°C (68°F) | 99.835 mm | -0.165 mm (ΔL contraction due to α = 110 × 10-6 / K) |
Advanced Shop-Floor Thermal Mitigation Protocols
To prevent thermal rejection across structural aluminum and engineering polymers, our production lines follow strict multi-step manufacturing protocols:
- Roughing-to-Finishing Decoupling: We rough-machine stock to within +1.0 mm of net dimensions, releasing extrusion or casting skin stresses, and then set the parts aside for 12 to 24 hours.
- Intermediate Stress-Relief Annealing: For complex PEEK, POM, and ultra-high-molecular-weight polyethylene components, parts undergo controlled oven ramp heating and slow furnace cooling prior to final finishing passes to neutralize internal crystalline tension.
- Razor-Polished Single-Crystal / Uncoated Carbide Tooling: We utilize ultra-sharp, high-rake (>18°) polished inserts ground specifically for plastics to slice chips cleanly rather than plowing material, minimizing cutting friction and frictional heat generation.
- 24-Hour Metrology Soak: All tight-tolerance components (≤ ± 0.01 mm) soak in our climate-controlled CMM inspection facility at 20°C ± 0.5°C for a minimum of 24 hours before final dimensional sign-off, matching the inspection protocols detailed in our CNC machining tolerances standard.
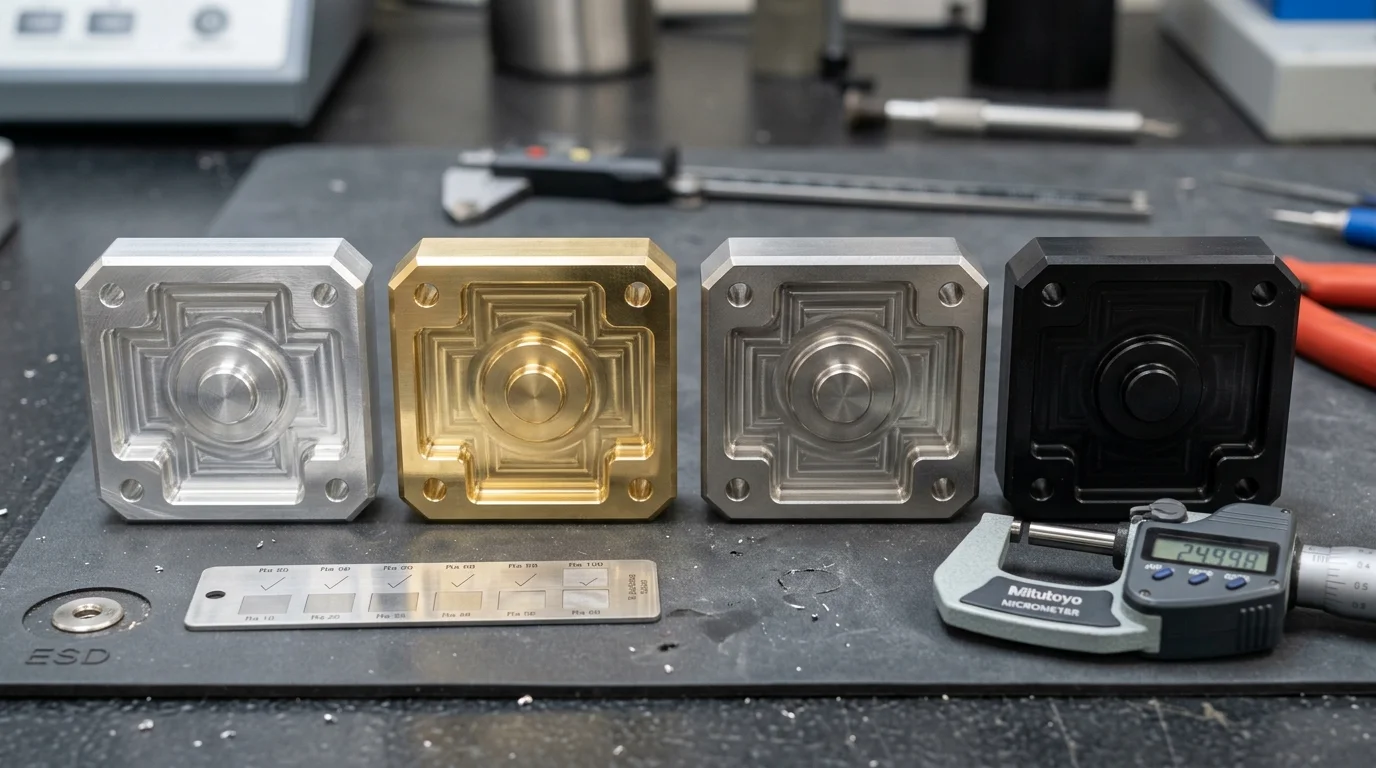
5. Finished Part Cost Dynamics: Raw Material vs. Machining Cycle Time
A pervasive pitfall in procurement is selecting materials based purely on raw billet price per kilogram. In subtractive manufacturing, raw material cost is only one component of a multi-variable financial equation.
The Complete Machined Part Cost Equation
The true unit cost of a CNC machined component is expressed mathematically by:
Cpart = (mbillet × Praw – mscrap × Pscrap) + (tcycle × Rmachine) + Ctooling + (Csetup + Cprog) / Q + Cfinish
Where:
- m_{billet} = Initial raw stock billet mass (kg)
- P_{raw} = Raw material purchasing price (/kg)
- m_{scrap} × P_{scrap} = Scrap swarf recovery credit (often negligible for small batches)
- t_{cycle} = Total spindle cutting, tool change, and indexing time (hours)
- R_{machine} = Loaded hourly machine center rate (/hour, spanning \45–\65/hr for 3-axis mills to \90–\150/hr for 5-axis mill-turn centers)
- C_{tooling} = Cutter wear, specialty insert consumption, and solid carbide depreciation
- Q = Batch production quantity over which non-recurring engineering (NRE) setup is amortized
- C_{finish} = Secondary chemical and thermal processing costs (anodizing, plating, heat treatment)
For a deeper dive into setup amortization curves, review our CNC machining cost engineering breakdown.
Case Study 1: 304 Stainless Steel vs. 303 Free-Machining Stainless
To see this dynamic in practice, consider an illustrative buyer scenario: A hydraulic sensor housing requiring external threading, deep interior bore boring, and cross-drilled fluid ports is evaluated in 304 versus 303 stainless steel. The batch size is 500 pieces.
| Cost Variable (500 pcs Batch) | Grade 304 Stainless | Grade 303 Free-Machining Stainless | Variance & Impact |
|---|---|---|---|
| Raw Billet Stock Cost | 4.80 / kg | 5.20 / kg | +8.3% higher stock price for 303 |
| Milling Cycle Time per Part | 22.5 minutes | 9.0 minutes | -60% spindle run time with 303 |
| Machine Cost (@ 70/hr) | 26.25 / part | 10.50 / part | -15.75 machine savings per part |
| Tooling Wear & Insert Cost | 4.50 / part | 1.10 / part | -75% insert replacement cost |
| Total Machined Part Cost | 35.55 / part | 16.80 / part | 52.7% Net Savings with Grade 303 |
The Engineering Takeaway: While raw 303 stainless stock costs 8\% more per kilogram due to sulfur alloying additions, its AISI machinability index of 140\% (vs. 45\% for 304) reduces spindle cycle time by 60\% and cuts tool wear by over 75\%. Unless the part requires immersion in harsh acidic environments or direct structural welding (where sulfur induces hot-cracking), specifying 303 saves the buyer nearly 56\% in total part cost.
Case Study 2: Aluminum 6061-T6 vs. 7075-T651
In aerospace structural housings requiring high material removal ratios (>80\% of billet converted into chips):
- Raw 7075-T651 billet costs approximately 2.2× more per kilogram than 6061-T6 (P_{raw} ≈ \7.50/kg vs. \3.40/kg).
- However, both alloys machine at rapid surface speeds (v_c > 300 m/min) on modern high-speed machining centers. Spindle cutting cycle time difference is negligible (<10\%).
- Decision Driver: The cost delta between 6061 and 7075 is driven almost entirely by the weight of raw billet purchased and turned into swarf (m_{billet} × P_{raw}). If yield strength above 300 MPa is not required by FEA stress simulations, specifying 6061-T6 prevents unnecessary raw material cost overhead.
Case Study 3: POM-C Delrin vs. PEEK
- Semi-crystalline POM-C rod costs roughly \8–\14/kg, whereas medical/semiconductor grade unfilled PEEK 450G rod costs upwards of \140–\220/kg—a 15× to 20× premium.
- On a high-volume PEEK order, machine cycle time is dwarfed by raw stock material costs.
- Manufacturing Recommendation: Designers targeting PEEK must optimize billet stock dimensions, nesting density, and near-net-shape sizing to avoid turning hundreds of dollars of costly resin into swarf.
6. Application-Driven Material Selection Framework
When selecting materials from our master chart, mechanical engineers must align the operating environment, loading dynamics, and regulatory compliance constraints against alloy properties.
| Target Performance Category | Primary Recommended Materials | Key Engineering Selection Rationale |
|---|---|---|
| High Strength-to-Weight | 7075-T651 Aluminum / Ti-6Al-4V Gr5 | Yield strength > 500 MPa with low mass density for aerospace, robotics, and racing. |
| Chemical & Marine Immersion | 316L Stainless / PEEK / PTFE | Molybdenum alloying (316L) or inert fluoropolymer chains resisting chlorides and harsh acids. |
| High Wear & Structural Toughness | 4140 Pre-hardened / 1045 / Delrin POM-H | High surface fatigue limits, impact toughness, and sliding wear resistance for gears and shafts. |
| Ultra-Precision (±0.005 mm Stability) | 6061-T651 / C360 Brass / PEEK-GF30 | Stress-relieved crystal matrix minimizing residual stress distortion and thermal drift. |
| Electrical & Thermal Dissipation | C110 Copper / 6063 Aluminum | Maximum thermal conductivity (> 200 W/m·K) for power semiconductor cold plates and busbars. |
High Strength-to-Weight Aerospace & Robotics Structurals
- Primary Choice: Aluminum 7075-T651 (R_{p0.2} = 503 MPa, Density 2.81 g/cm^3, Strength-to-Weight Ratio ≈ 179 kN×m/kg).
- Alternative for Extreme Temperatures (>120°C): Titanium Grade 5 Ti-6Al-4V (R_{p0.2} = 880 MPa, Density 4.43 g/cm^3, Strength-to-Weight Ratio ≈ 198 kN×m/kg). Titanium maintains structural integrity at temperatures up to 400°C where aluminum yields.
Chemical, Marine, and Harsh Electrolyte Immersion
- Primary Metallic Choice: Stainless Steel 316L (2.5\% Molybdenum content resists localized pitting in chloride and saltwater environments).
- Primary Polymer Choice: PTFE (Teflon) or PEEK. PTFE provides nearly universal chemical inertness across pH 0–14, while PEEK adds structural rigidity and high-temperature steam sterilization resistance.
Wear Resistance, Sliding Friction, and Dynamic Bushings
- Unlubricated Structural Sliding: POM-C (Delrin). Low coefficient of friction against metals (μ ≈ 0.25–0.35), high abrasion resistance, and zero requirement for external grease lubrication.
- High-Impact Shock Bearings: Pre-hardened Alloy Steel 4140 (quenched and tempered to 28–32 HRC) or Class 40 Gray Cast Iron (graphite flakes provide internal dry lubricity and vibration damping).
Thermal Dissipation and Electronic Enclosures
- High-Efficiency Heat Dissipation: Pure Copper C101 / C110 (Thermal Conductivity k ≈ 390 W/m×K). Supports rapid thermal transfer in liquid cooling cold plates.
- Balanced Enclosures & Cold Plates: Aluminum 6061-T6 (k ≈ 167 W/m×K). Delivers sufficient thermal conductivity at a third of copper’s weight and a quarter of its finished part cost.
High-Volume Screw Machining & Fasteners
- Threaded Fasteners & Standoffs: Free-Cutting Brass C360 or 12L14 Carbon Steel. Enables spindle speeds above 4,000 RPM with rapid cycle times, minimal burring, and low tool wear.
7. Quality Assurance & Material Verification Protocols
Procuring high-value machined components from international suppliers requires verified material authenticity. A drawing specifying 316L stainless steel or 7075-T6 aluminum must be backed by documented chemical and physical verification to prevent substandard material substitutions.
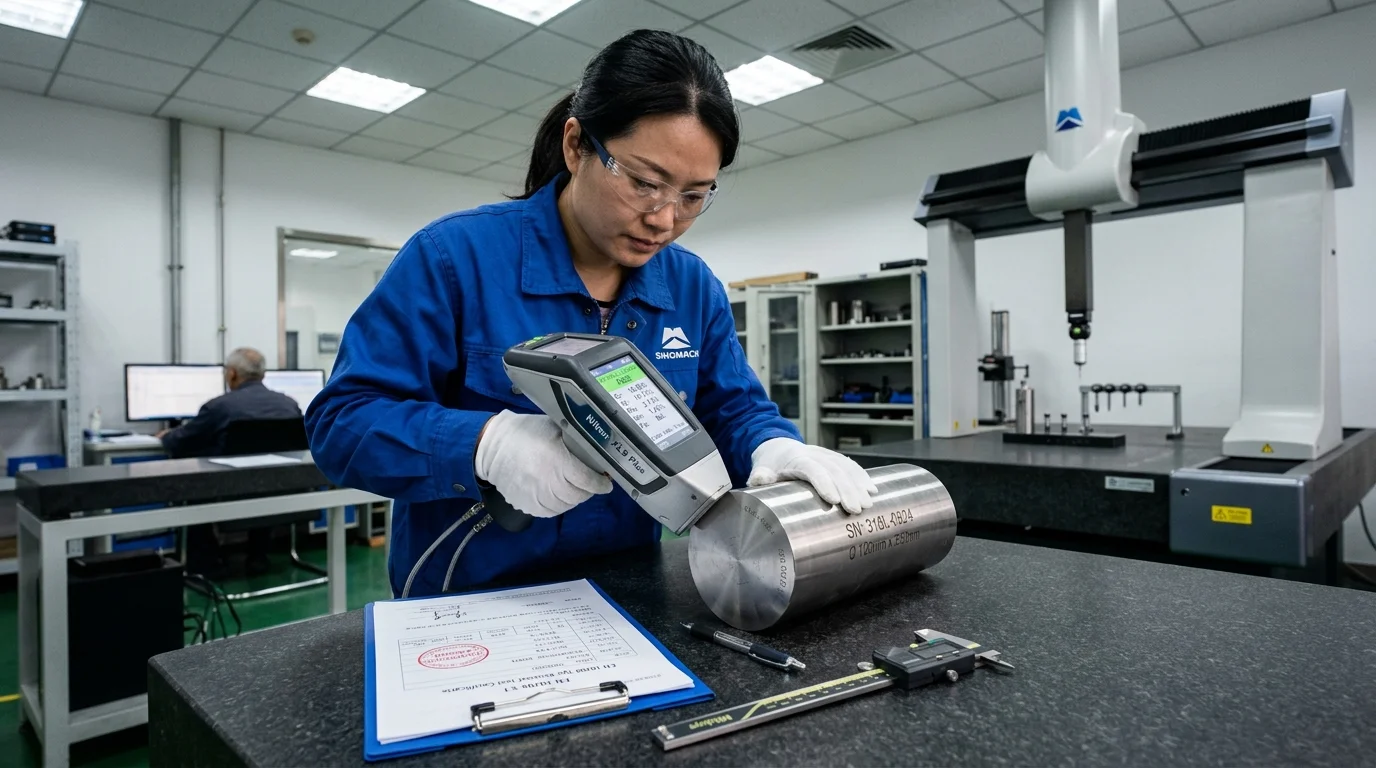
At CNMP, our manufacturing and quality inspection infrastructure ensures full material integrity from billet intake to final coordinate metrology:
1. Certified EN 10204 Type 3.1 Mill Test Reports (MTRs)
We enforce strict heat-lot traceability across all incoming metal stock. Every batch of aluminum plate, carbon steel bar, or stainless round rod is accompanied by an EN 10204 Type 3.1 Mill Test Certificate documenting:
- Full spectrographic chemical composition (verifying carbon, nickel, chromium, molybdenum, and trace element percentages).
- Mechanical property validation (tensile yield strength, elongation percentage, and heat-lot hardness).
- Direct traceability linking physical raw billet stamping numbers to the original smelter heat record.
2. In-House Positive Material Identification (PMI via XRF)
To guarantee that non-conforming or mixed raw stock never enters production CNC cells, incoming stock undergoes non-destructive Positive Material Identification (PMI) testing using handheld X-ray fluorescence (XRF) analyzers. This testing instantly verifies alloy composition—ensuring, for example, that 304 stainless is never mistakenly machined in place of molybdenum-bearing 316L for corrosive applications.
3. Ultrasonic Flaw & Porosity Detection
For heavy structural components machined from thick aluminum billets (>60 mm plate) or forged alloy rounds, internal porosity, shrinkage cavities, or inclusions can compromise component integrity during aggressive pocket milling. We deploy ultrasonic immersion and contact testing on critical stock before machining begins.
4. Precision Climate-Controlled Metrology
CNC machining precision is verified using coordinate measuring machines (CMMs) from Zeiss and Mitutoyo, calibrated digital height gauges, optical tool presetters, and surface profilometers. Under controlled temperature conditions (20°C ± 0.5°C), our facility achieves machining tolerances down to ± 0.005 mm (5 μm / ± 0.0002 in) on critical bearing fits, concentricities, and bore positions.
5. Tier-1 Automotive Pedigree and Flexible Scaling
Our quality control workflows are proven through long-term tier manufacturing partnerships with leading global brands. We manufacture precision air suspension valve blocks for Arnott and leak-free fluid transfer fittings for Dytech, operating under stringent IATF 16949-aligned APQP and PPAP Level 3 documentation standards.
Whether you require a single rapid prototype to validate mechanical fit or full-scale production batches:
- Minimum Order Quantity (MOQ) = 1 Piece: We support single-piece prototyping with rapid turnaround times (3–5 business days).
- Bridge-to-Production Manufacturing: Flexible scaling from 10 to 1,000+ pieces with dedicated fixtures and scheduled batch deliveries.
To initiate an engineering review or request a fast, competitive quotation on your next project, visit our commercial hub to explore our complete CNC machining materials inventory, or connect with our technical sales team directly by submitting your STEP files and 2D engineering drawings.